Grafana
Grafana is an open source analytics and interactive visualization web application. It provides charts, graphs and alerts for the web when connected to the supported data sources.
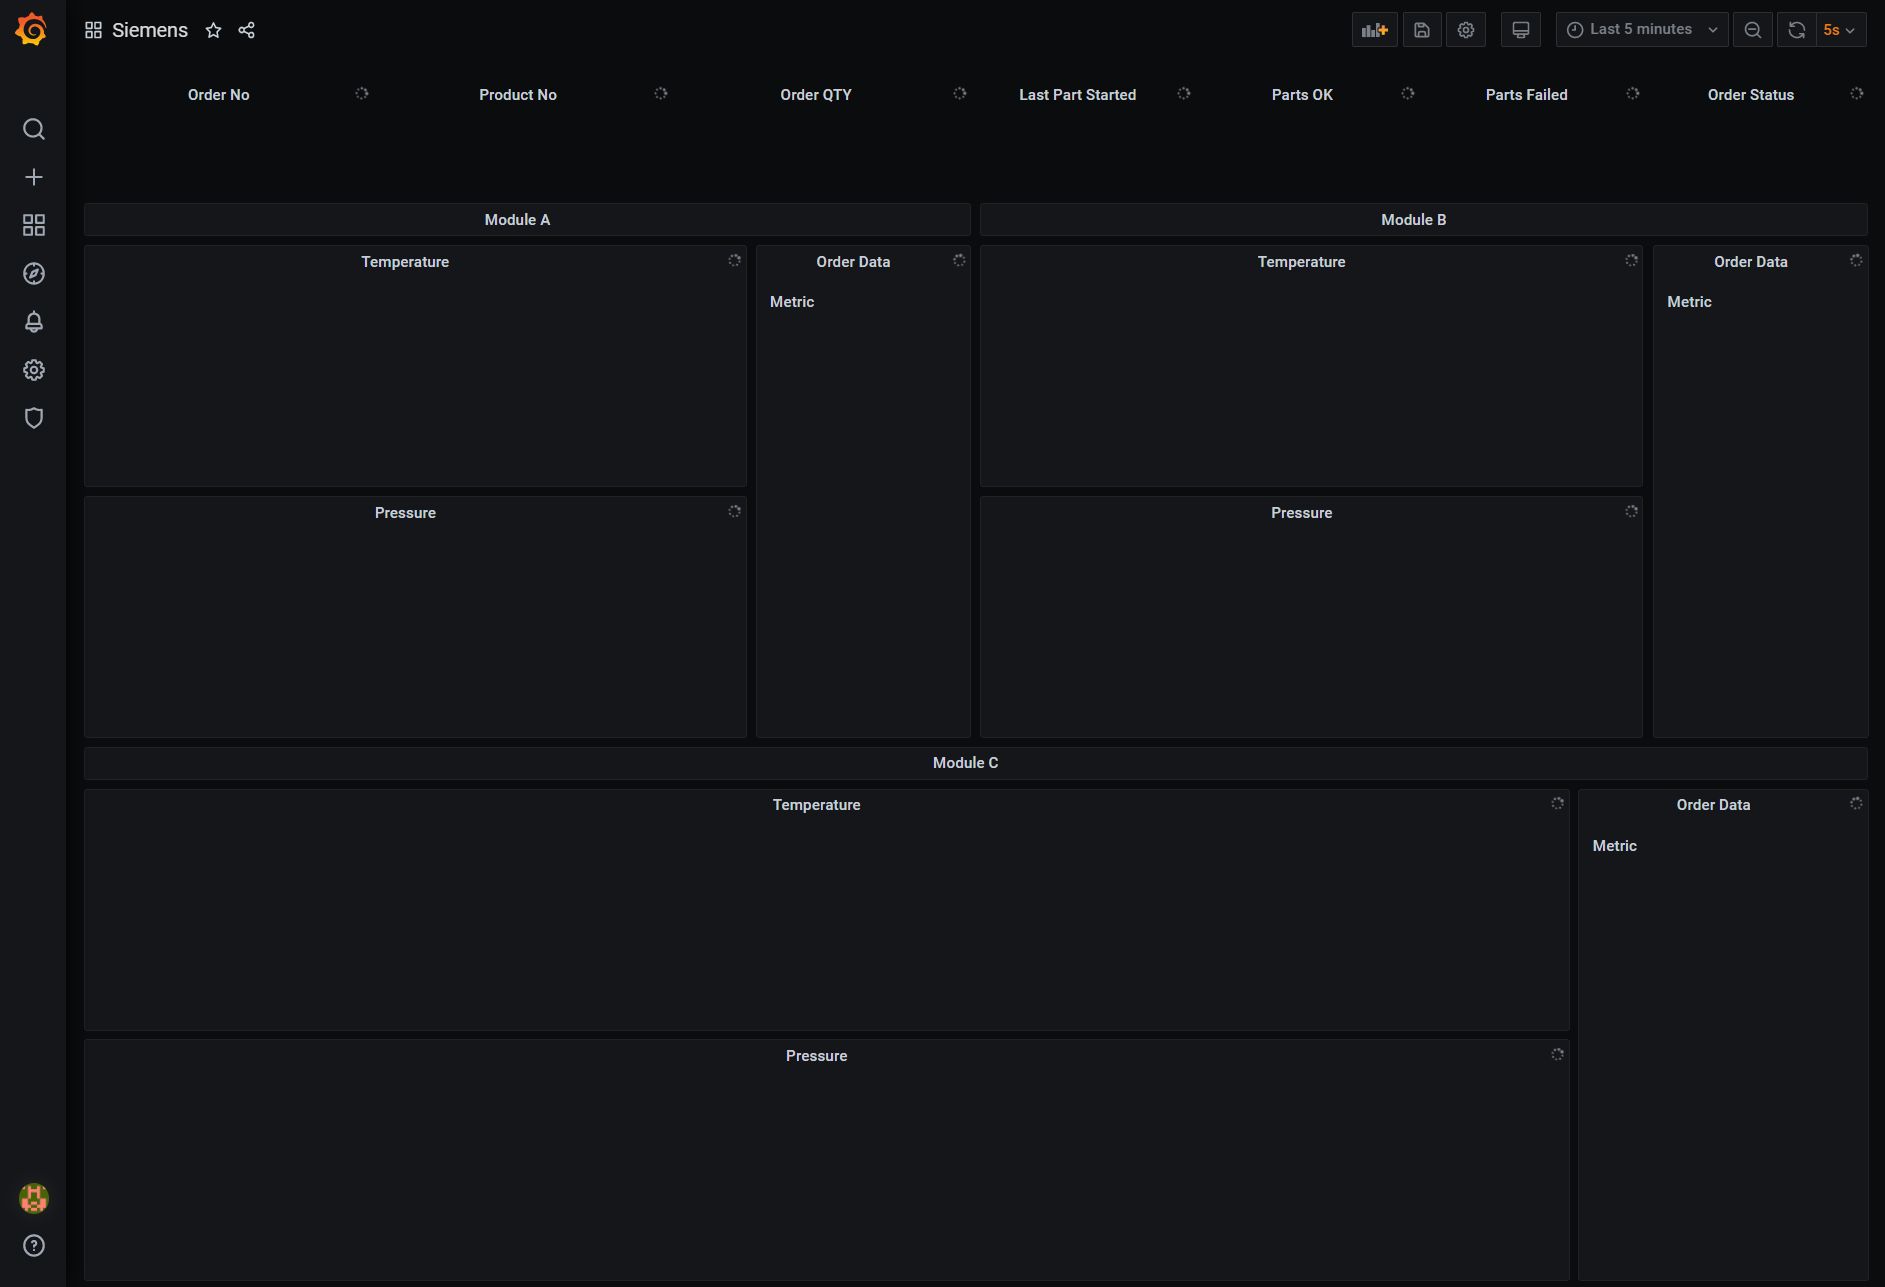
In the current demonstrator, Grafana is used to display the key parameters sent by the Equipment Simulator.
Access Grafana
Follow the steps bellow to access Grafana:
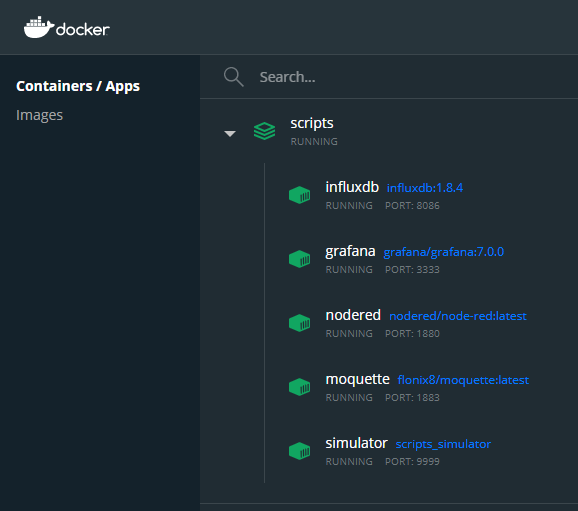
Grafana Docker container must be running.
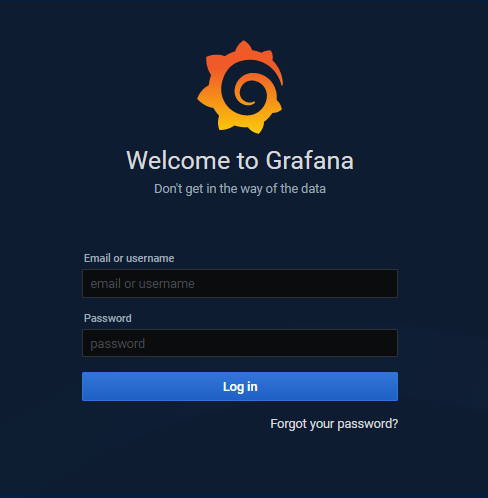
Open an Internet Browser (e.g., Chrome or Firefox) and navigate to http://localhost:3333/. For “Username” and “Password” use admin.
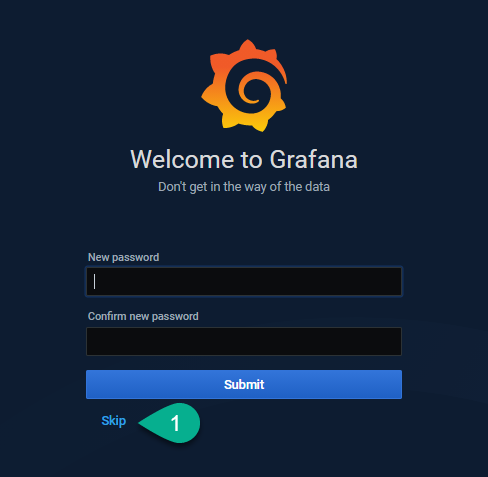
Change the “Password” or just select the “Skip” button (1).
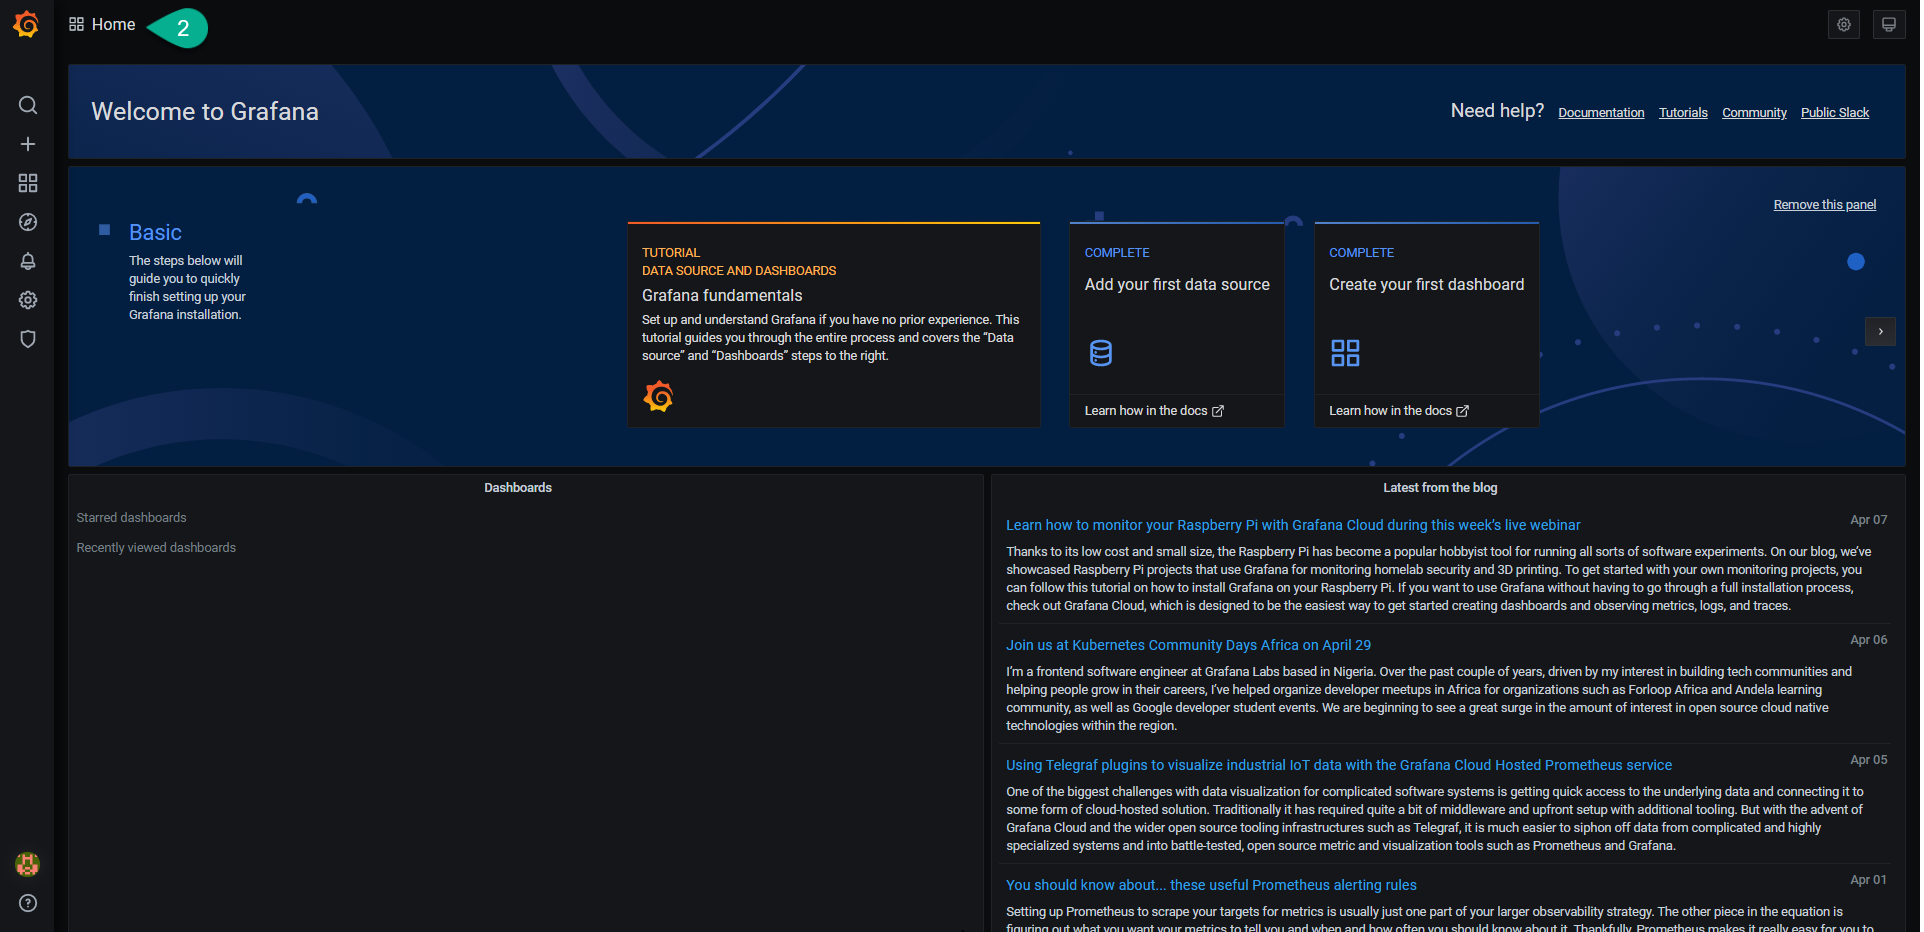
Select the “Home” button (2).
Select “Siemens” options (3).

The Grafana Siemens Dashboard is visible.
