How to monitor a deployed Instance
Log Viewer
SMARTUNIFIER comes with an integrated log viewer, which helps to gain insights in deployed and running Communication Instance.
The log viewer will show the details of logs based on the level defined throughout the creation of the deployment.
Log Levels
- TRACE
The most fine-grained information only used in rare cases where full visibility of what is happening inside a Communication Instance.
- DEBUG
Less granular compared to the TRACE level, but more than needed in an production environment. The DEBUG log level should be used for troubleshooting an faulty Communication Instance or when running a Communication Instance inside a test environment.
- INFO
Is the standard log level used for a standard deployment of a Communication Instance.
- WARNING
Log level that indicates that something unexpected happened inside a Communication Instance that might cause problems for the course of communication.
Log Viewer operation
Logs can be accessed by clicking the “Log” button (1).

Log Viewer comes with the following features:
Font size adjustability (2)
Searching, based on a regular expression (Regex) (3)
Start/Stop to “freeze” the current logging in order to investigate already printed log lines (4)
Follow Tail, to skip through to the latest log line (5)

Dashboard
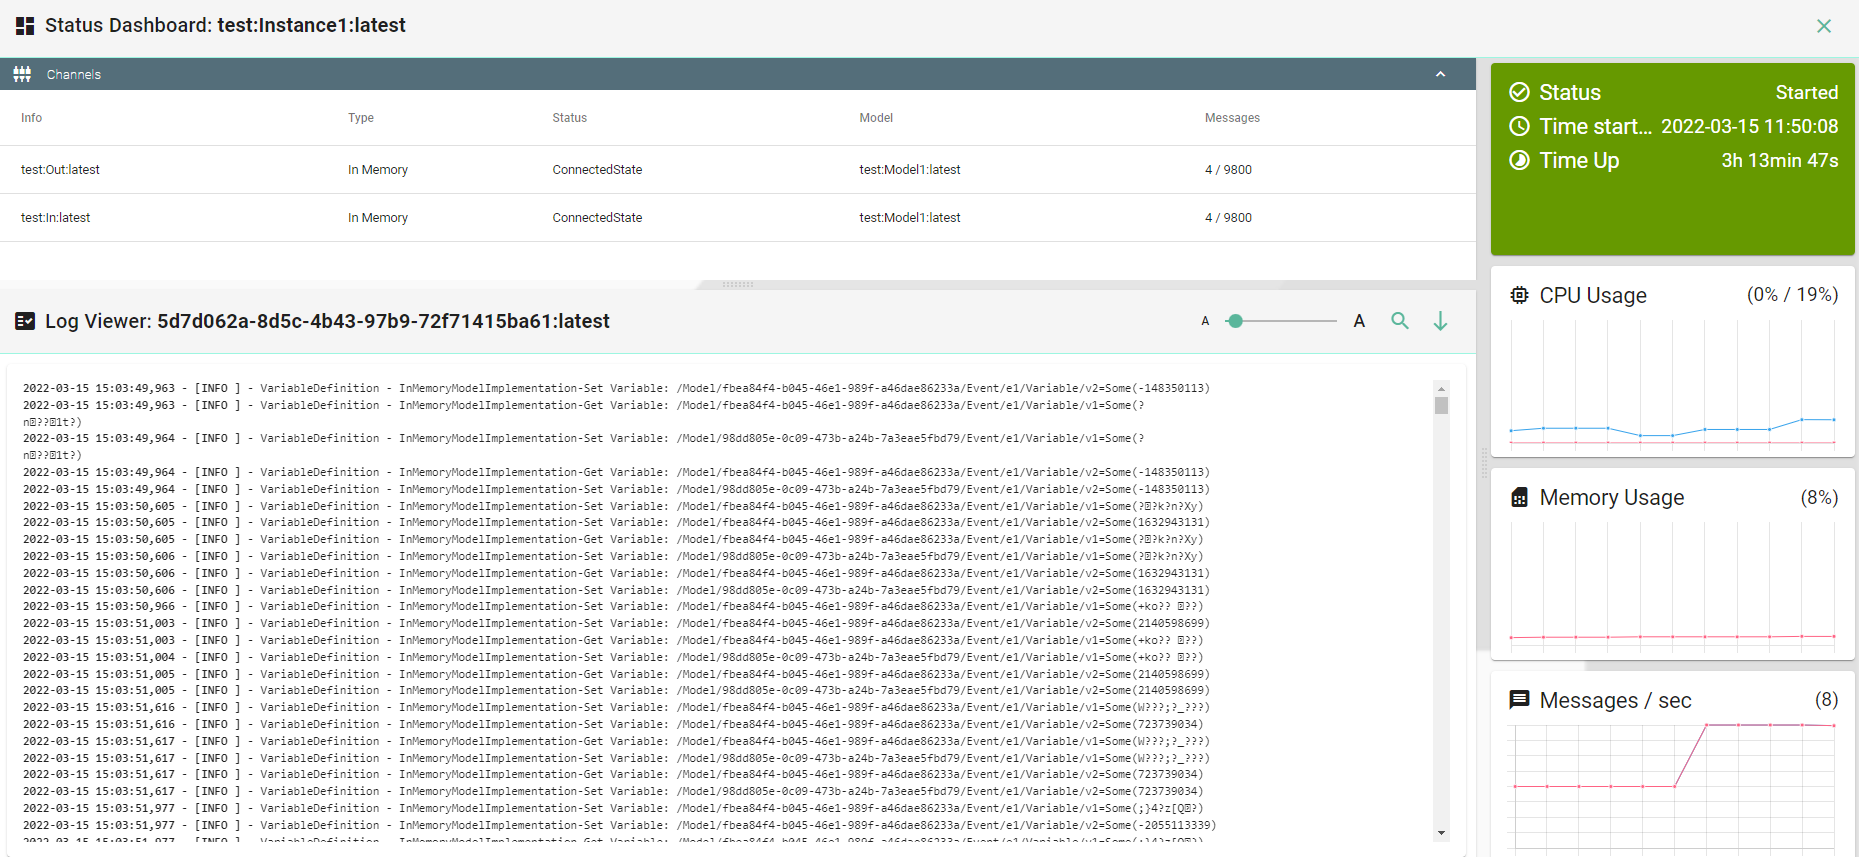
In order to monitor an Instance, access the Dashboard view by clicking the “Dashboard” button (6).
If the Instance is in the state NotDeployed the Dashboard cannot be accessed.

The Dashboard provides the following information:
Channels associated with the Instance
Status of the Instance
Start time of the Instance
Instance Time Up
CPU Usage of the Instance
Memory Usage of the Instance
Sent and received messages
