How to monitor Communication Instances
Note
Monitoring a Communication Instance is only possible after it has been deployed.
Log Viewer
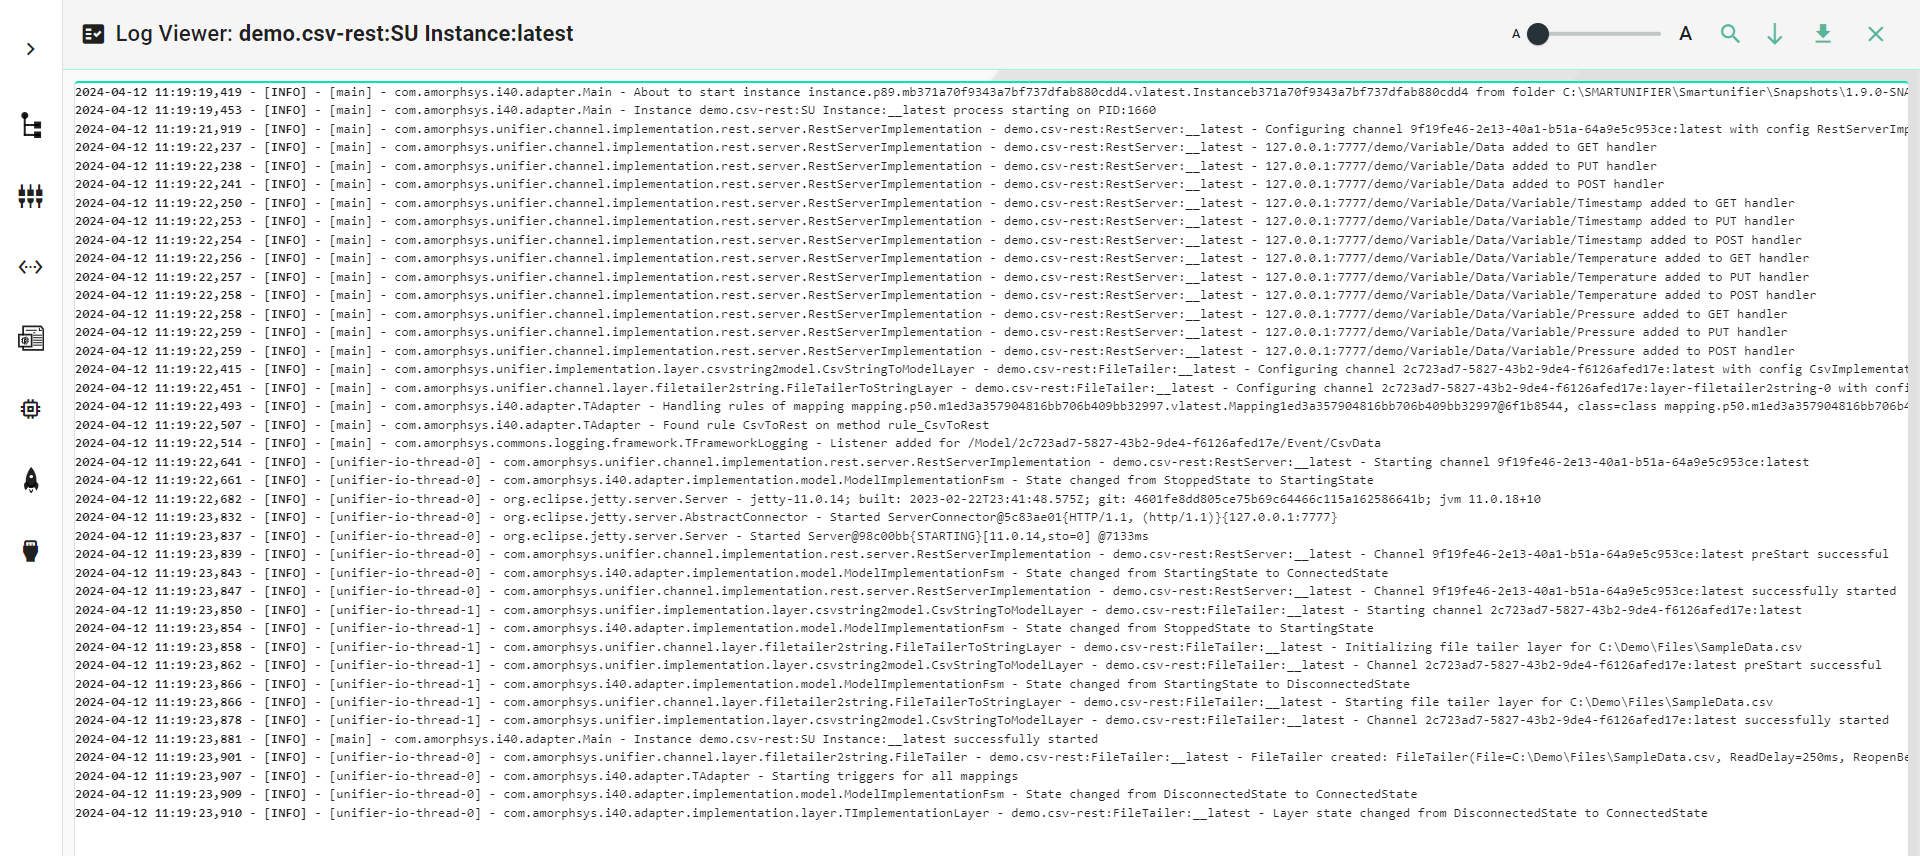
SMARTUNIFIER includes an integrated Log Viewer, offering insights into deployed and operational Communication Instances.
Accessing the Log Viewer
To access the Log Viewer, follow these steps:
Navigate to the Deployment view (1)
Ensure the Instance is deployed and started (2)
Click on the Log button (3)

The Log Viewer displays logs for a deployed Communication Instance.

Log Levels
The Log Viewer displays log details based on the level defined during the creation of the deployment:
TRACE - Provides the most detailed information, used only in rare cases for full visibility into the operations of a Communication Instance
DEBUG - Offers less detail than TRACE but more than what is typically needed in a production environment. The DEBUG log level is suitable for troubleshooting issues with a Communication Instance or for use in a test environment
INFO - The standard log level for regular deployment of a Communication Instance, providing essential operational information
WARNING - This log level signifies an unexpected occurrence within a Communication Instance that may lead to issues in communication
Structure of a Log Entry
The following table shows the structure of a log entry for a communication instance using two example log entries.
Timestamp |
Log Level |
Thread |
Class |
Description |
|---|---|---|---|---|
2024-02-19 16:53:16,663 |
[INFO] |
[main] |
com.amorphsys.i40.adapter.Main |
Instance demo.csv-rest:SU Instance:__latest successfully started |
2024-02-19 16:53:16,713 |
[ERROR] |
[unifier-io-thread-0] |
com.amorphsys.unifier.channel.layer.filetailer2string.FileTailer |
demo.csv-rest:File:__latest - File C:DemoFilesSampleData.csv does not exist |
Log Viewer Features
The Log Viewer offers several features for enhanced usability:
Adjust Font - Use the slider to change the size of the log font (1)
Filter - Apply a search using a regular expression (Regex) to find specific log entries (2)
Scroll to End - Engage the Follow Tail feature to automatically display the most recent log lines (3)
Download Logs - Download the logs as a ZIP file onto your computer for further analysis or sharing (4)
Close - Exit the Log Viewer and go back to the Deployment perspective (5)

Dashboard
SMARTUNIFIER provides a Dashboard with an integrated Log Viewer, which helps to gain insights in running Communication Instance performance.
How to access the Dashboard
Follow the steps bellow to access the Dashboard:
Select the SMARTUNIFIER Deployment perspective (1)
Make sure the Instance is Deployed (2)
Click on the Dashboard button (3)

Dashboard’s Data
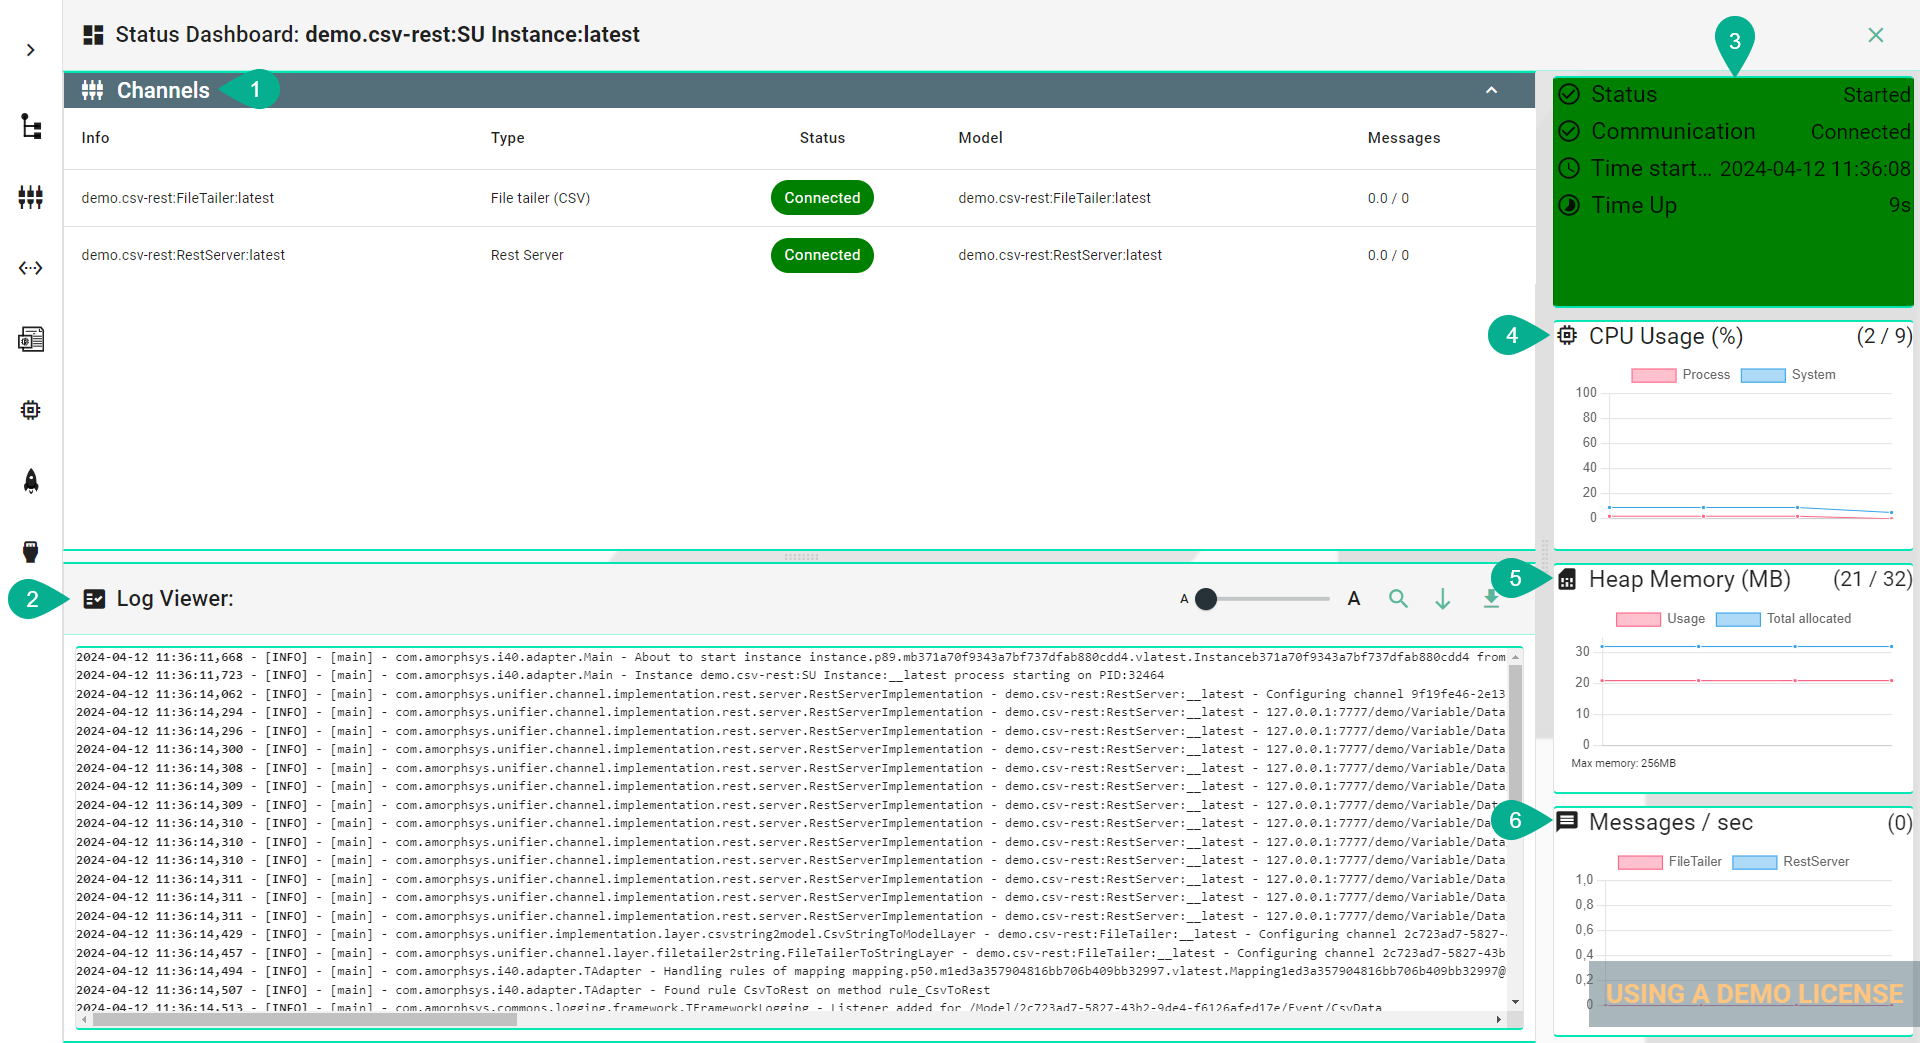
The Dashboard presents a overview of an Instance, showcasing the following key information:
Information about Channels that are used in the Instance:
Info - Name of the Communication Channel
Type - Communication Channel Type
Status - Current connection status of the Channel
Model - Associated Information Model
Messages - Number of messages last second / Number of messages last hour (e.g. 30/500)
Hint
The quantity of messages is determined by the Node Types used in the Information Model. Each occurrence of an Event or Command is considered as a single message. On the other hand, when it comes to variables, each individual variable is counted as a message, given that it has been configured within the designated communication channel.
Integrated Log Viewer
Status of the Instance:
Status - Shows if the Instance is currently started or stopped
Communication - Shows the status of the Communication Channels Connected or Stopped
Start time - Shows the time when the Instance was started
Time Up - Shows the duration or uptime of the instance
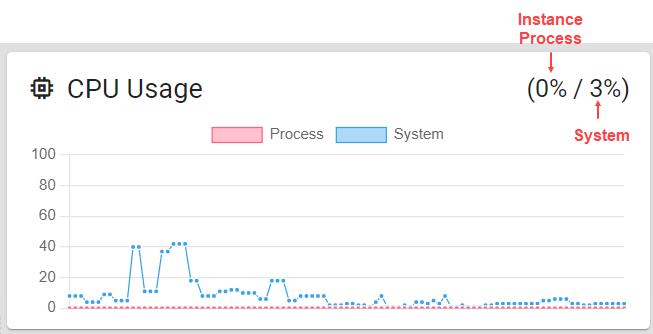
CPU Usage - Instance CPU usage in % and system CPU usage in %

Memory Usage - Instance Java memory heap usage in MB (megabyte)
Hint
Constant increase in the Java heap space memory might indicate memory leaks that requires
Messages / sec - Number of total messages of all Communication Channels within the last second
