How to monitor Communication Instances
Note
Monitoring of a Communication Instance is only possible after deployment.
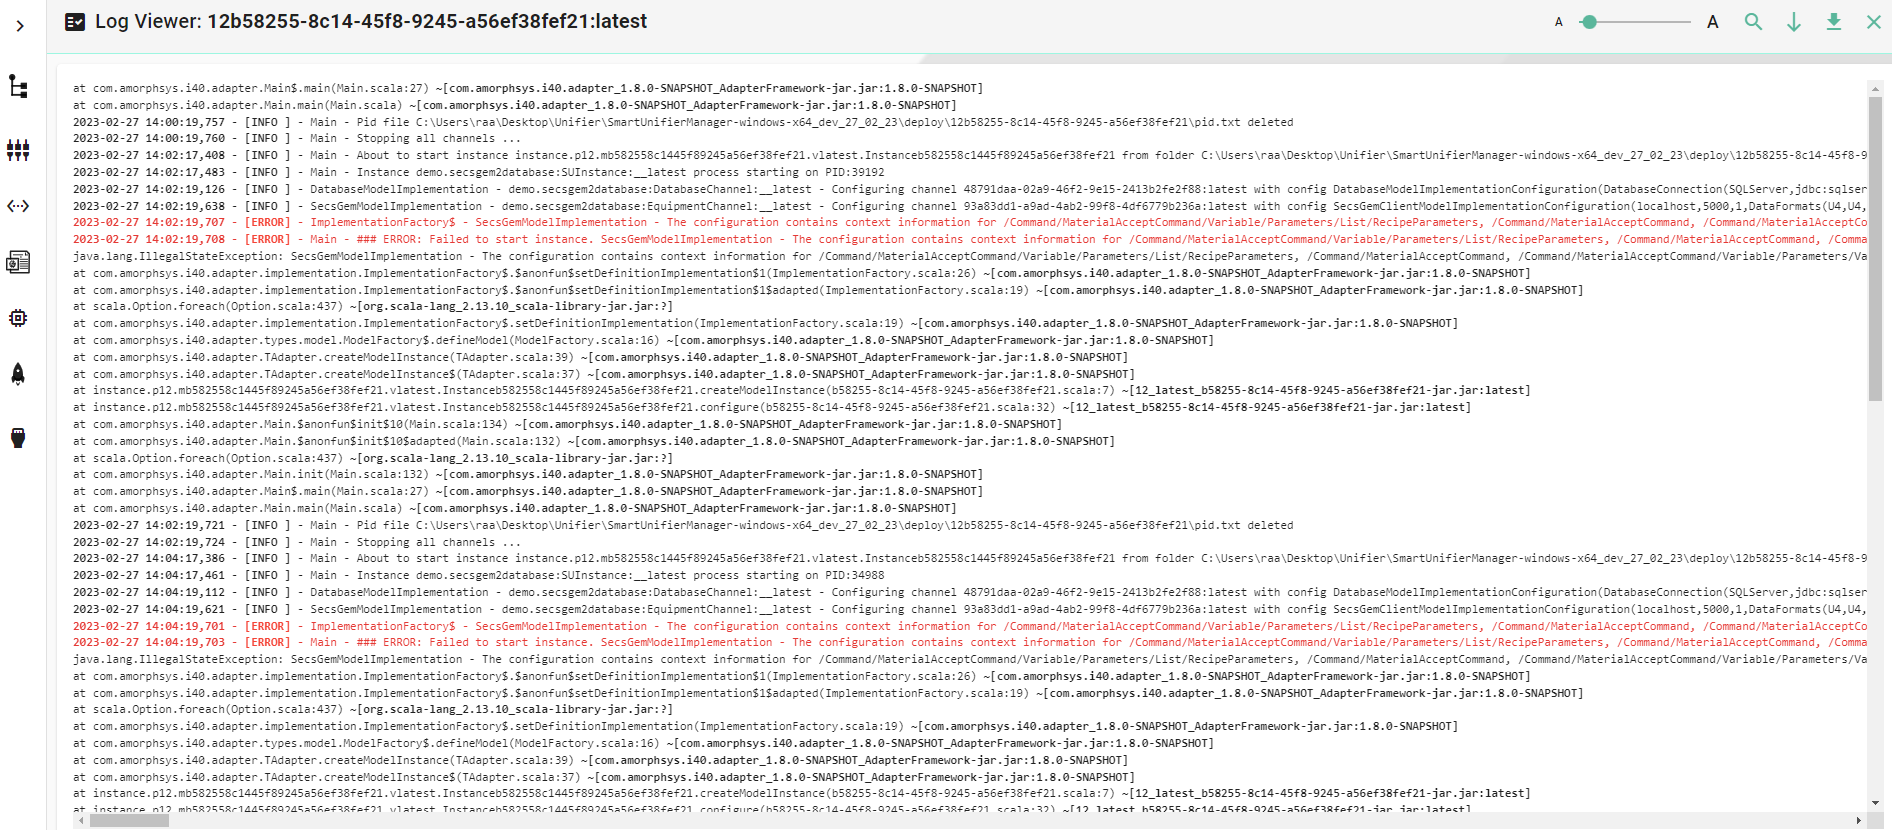
Log Viewer
SMARTUNIFIER comes with an integrated Log Viewer that provides insights into deployed and running Communication Instances.
How to access
Follow the steps bellow to access the Log Viewer:
Select the SMARTUNIFIER Deployment perspective (1)
Make sure the Instance is Deployed (2)
Click on the Log button (3)

The Log Viewer is displaying the logs for the deployed Communication Instance

Log Levels
The log viewer will show the details of logs based on the level defined throughout the creation of the deployment:
TRACE - The most fine-grained information only used in rare cases where full visibility of what is happening inside a Communication Instance.
DEBUG - Less granular compared to the TRACE level, but more than needed in a production environment. The DEBUG log level should be used for troubleshooting a faulty Communication Instance or when running a Communication Instance inside a test environment.
INFO - Is the standard log level used for a standard deployment of a Communication Instance.
WARNING - Log level that indicates that something unexpected happened inside a Communication Instance that might cause problems for the course of communication.
Log Viewer Operations
Log Viewer provides the following features:
Adjust Font - Using the slider, the log font can be adjusted (1)
Filter - Searching based on a regular expression (Regex) (2)
Scroll to End - Follow Tail to make the latest log lines visible (3)
Download Logs - Save the logs into a ZIP file on the machine for analysis and sharing (4)
Close - To exit the Log Viewer and return to Deployment perspective (5)

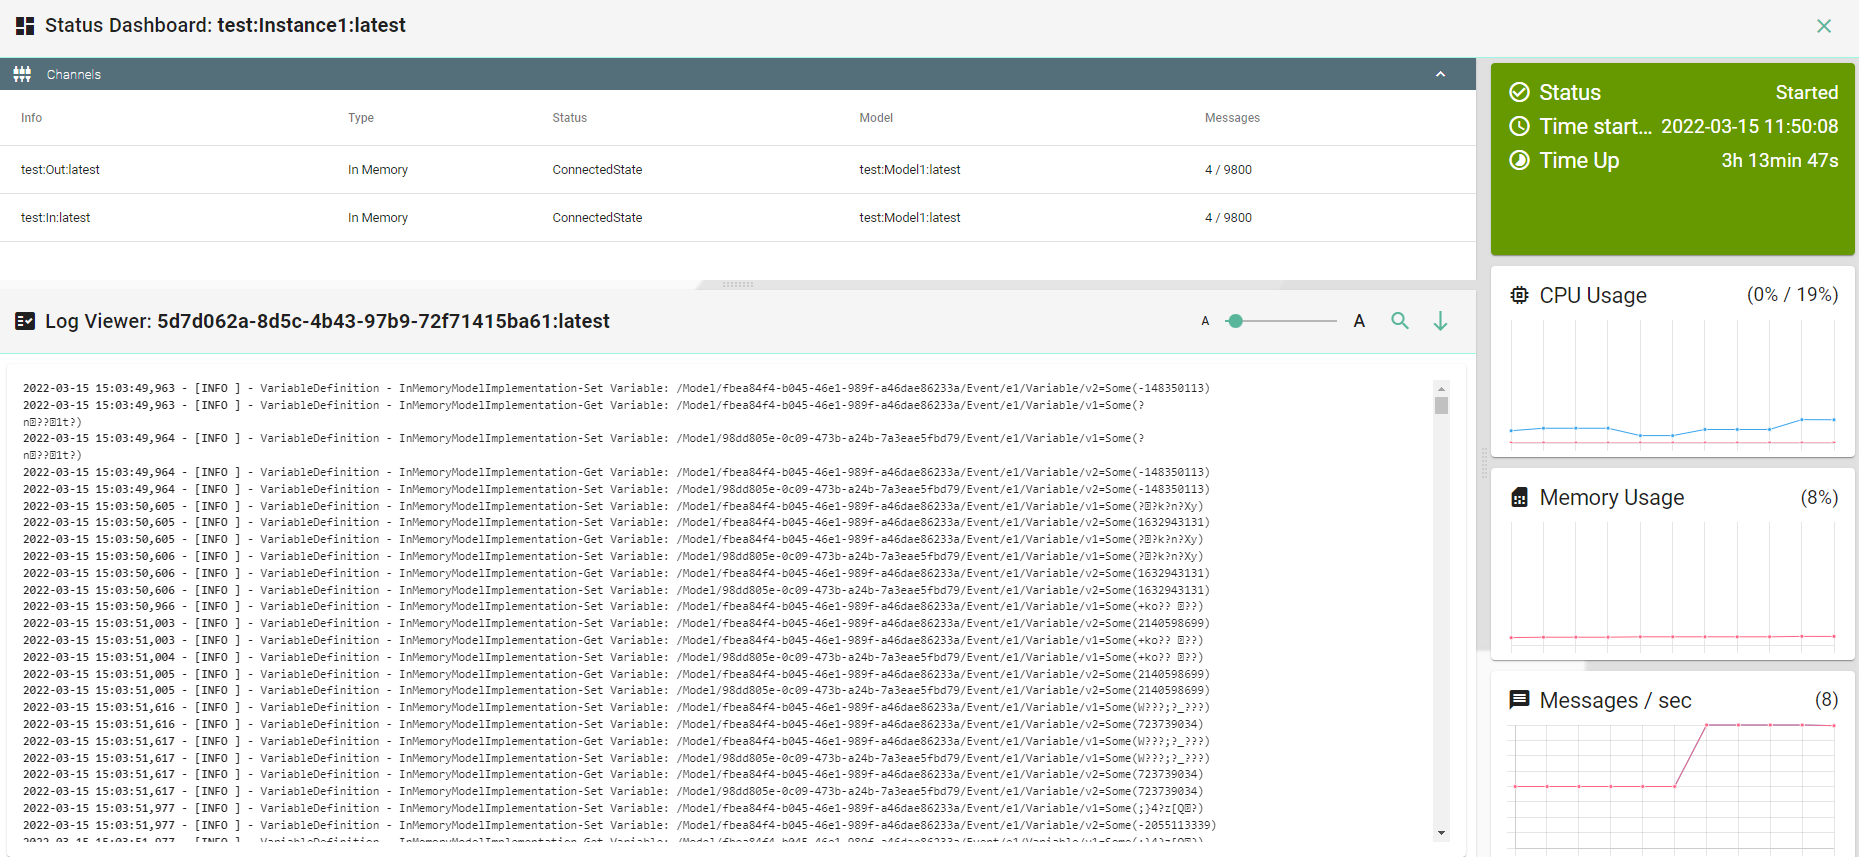
Dashboard
SMARTUNIFIER provides a Dashboard with an integrated Log Viewer, which helps to gain insights in running Communication Instance performance.
How to access
Follow the steps bellow to access the Dashboard:
Select the SMARTUNIFIER Deployment perspective (1)
Make sure the Instance is Deployed (2)
Click on the Dashboard button (3)

Dashboard’s Data
The Dashboard provides the following information:
Channels associated with the Instance
Status of the Instance
Start time of the Instance
Instance Time Up
CPU Usage of the Instance
Memory Usage of the Instance
Sent and received messages
